¶ COLUMN SETTINGS. CREATING A GROUP OF INDICATORS. COLUMN CONVERSION
¶ Column settings
Column settings include the ability to edit the “Name,” “Name (genitive case),” “Unit of measurement,” and “Number of decimal places” fields.
To open the column editing form, click on the gear icon at the top of the column (Fig. 1).
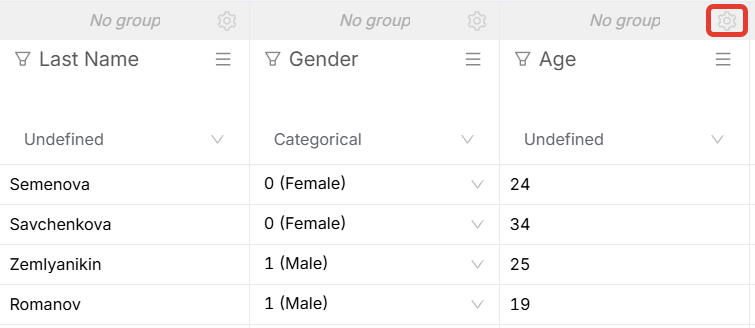
Figure 1 - Icon for opening the column settings form
After opening the form, fill in the required fields:
- “Name” - fill in the name of the column in the nominative case with a capital (uppercase) letter.
- “Name (in the genitive case)” - enter the name of the column with a lowercase letter, in the genitive case.
- “Name for display on graphs” - enter the name for display on the graph.
- “Units of measurement” - fill in for quantitative variables (mmol/l, g/l, full years, etc.).
- “Number of decimal places” - the number of digits after the decimal point with which the data will be displayed after calculation. Specify for quantitative variables.
Below is an example of filling out this form for a quantitative indicator (Fig. 2).
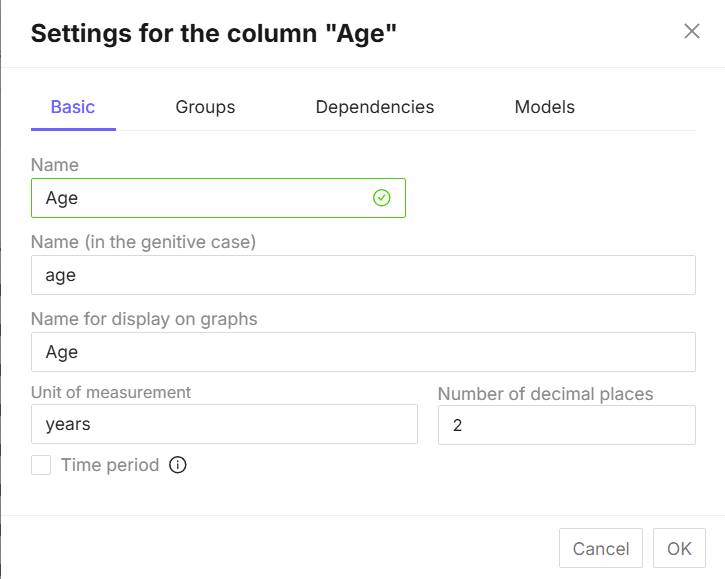
Figure 2 - Example of filling out the column settings form
The column settings for other types of variables have a simpler editing form, which contains only “Name” and “Name (in the genitive case)” (Fig. 3).
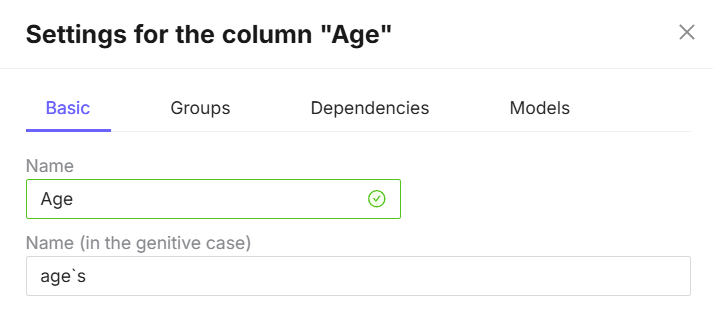
Figure 3 - Example of filling out the column settings form
The column settings also include a “Time period” function. It should be used if the indicator is temporary in nature for survival analysis (Fig. 4).
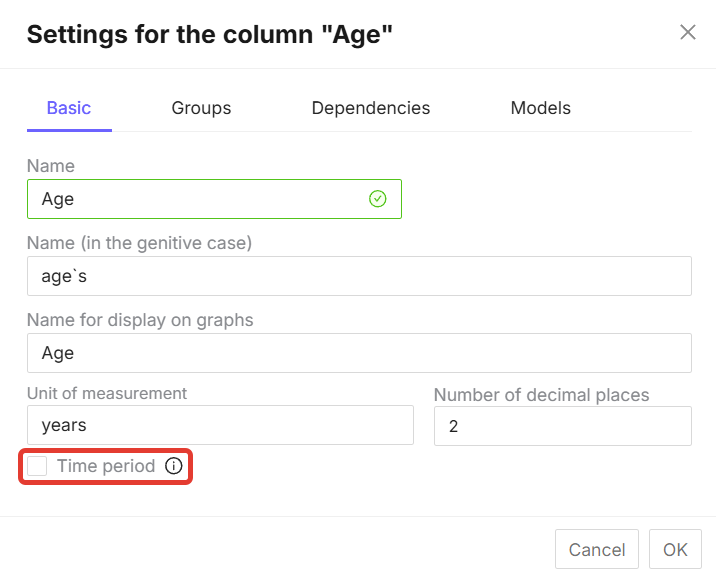
Figure 4 - “Time period” button in the column settings
To enable the “Time period” function, you need to check the box (Fig. 5).
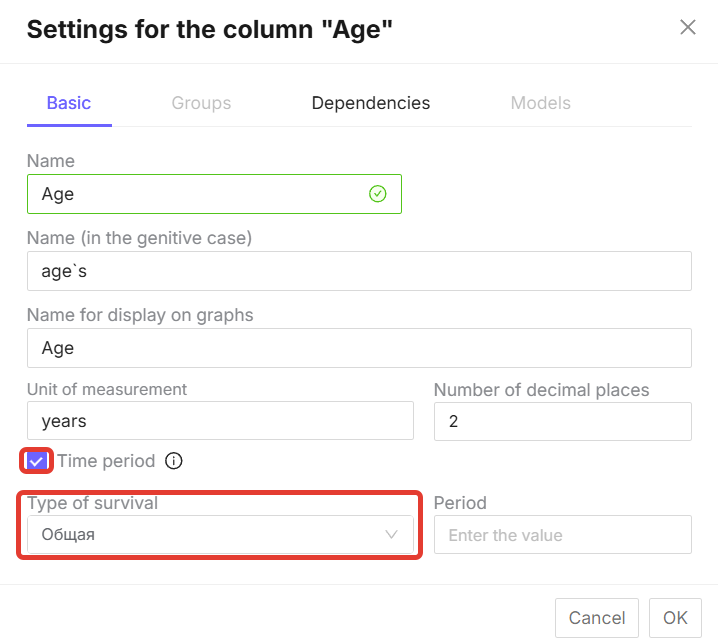
Figure 5 - “Time period” checkbox and active “Survival type” function
When you check the “Time period” box, the “Survival type” option becomes active (Fig. 5).
¶ Changing column names and categories for graphs
To change column names, click on the icon  . A column settings form will open, where you can enter the name that will be used in the legend on the graph in the “Name to display on graphs” line (Fig. 6).
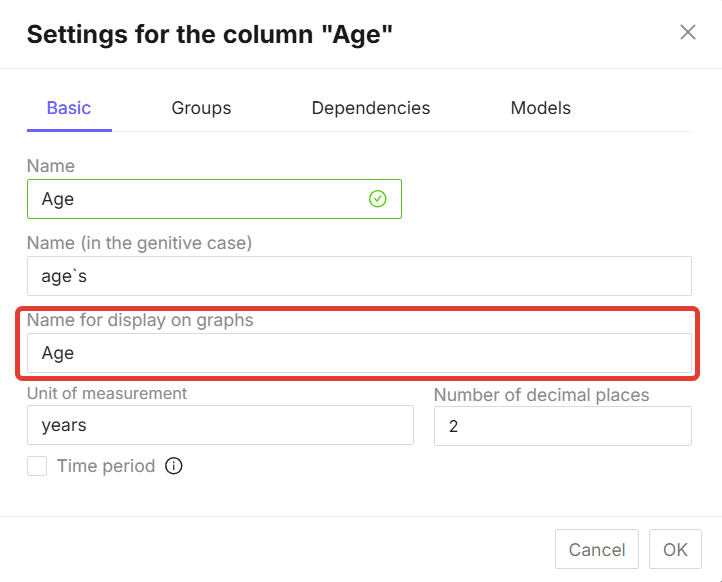
Figure 6 - “Name to display on graphs” field
To change categories, go to the category variable settings form and fill in the “Names to display on graphs” column (Fig. 7).
!!Checking the target category allows you to combine other categories into “Others” and make one category the target when analyzing survival, OS, OR, or logistic regression, provided that the variable has more than 2 categories.
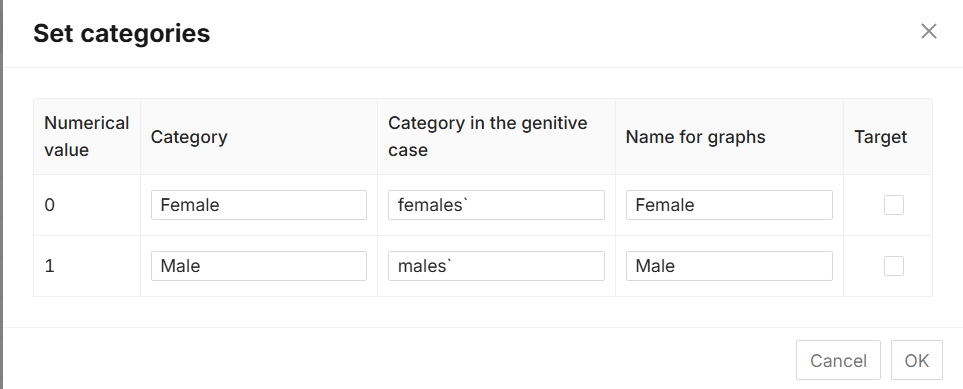
Figure 7 - Setting names for graphs in variable categories
¶ Creating a group of indicators
Indicator groups are used to combine several indicators. Only categorical or quantitative indicators can be combined in a group, but not both together, as this may lead to errors in the results. Each group created has its own color.
By default, all indicators are defined as “No group” when the database is loaded. To create a group of indicators or select an existing one, you need to go to the column settings via the  sign, then go to the “Groups” section (Fig. 8).
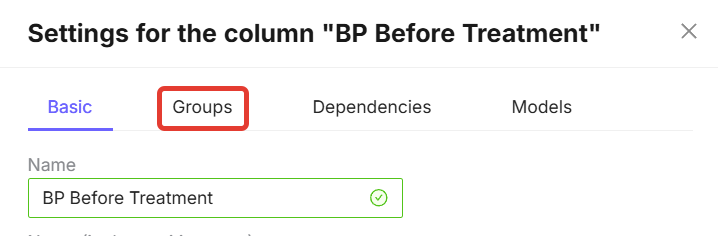
Figure 8 - “Groups” section in the column settings
In the “Groups” section, click the “Create new group” button and fill in the fields. In the first line, write the name of the group with a capital letter in the nominative case, below write the name of the group in the genitive case and click the check mark to save the changes (Fig. 4.9).
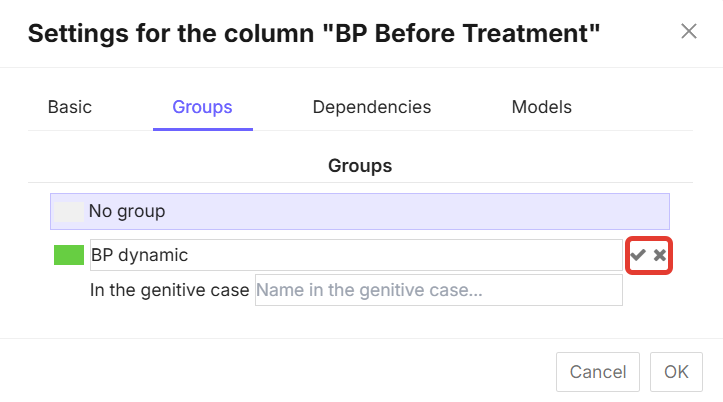
Figure 9 - Form for filling in a new group of values
To select the created group for the column, select the group and then click on the “OK” button (Fig. 10).
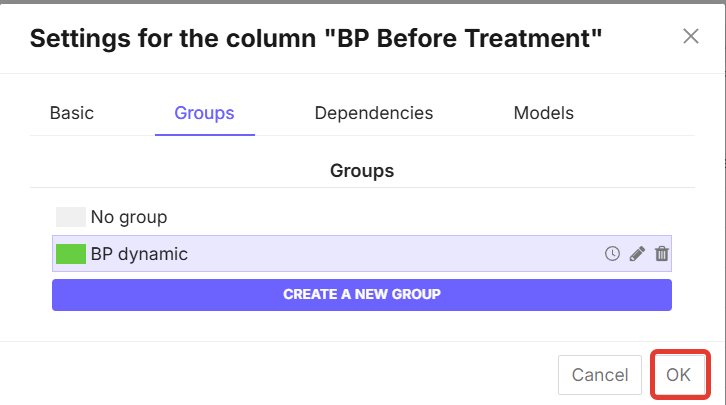
Figure 10 - Form for selecting a group of values
If you need to compare indicators in the “Before - After” format, click on the clock icon when creating a group  (Fig. 11).
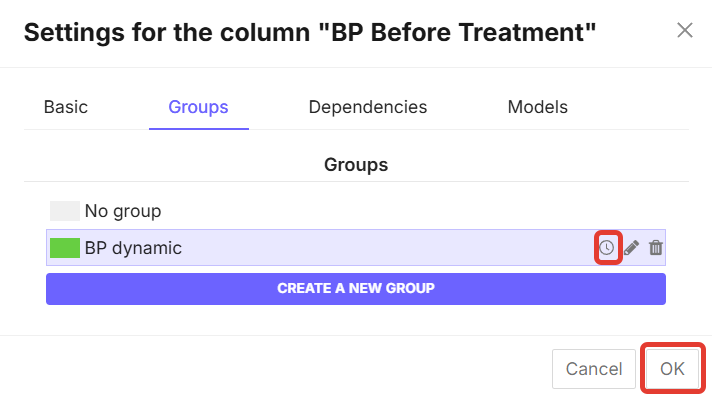
Figure 11 - “Before - After” settings button
By default, the column on which the group is created is already included in this group. You can remove it from the group by clicking on the “No group” button (Fig. 12).
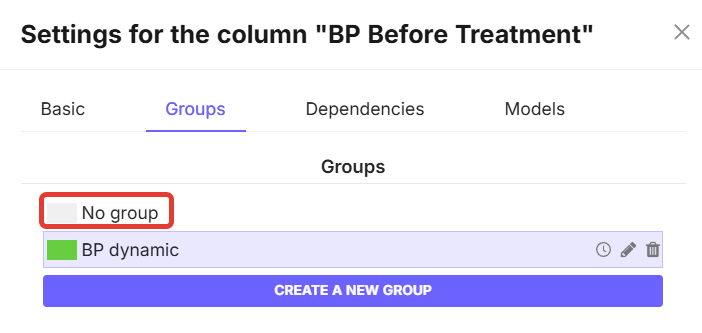
Figure 12 - “No group” button in the column settings
To include other indicators in the created group, select the column with the desired indicator, go to “Column settings” -> “Groups”. A list of all created groups will be displayed on the screen. Select the desired group by clicking on its name (Fig. 13).
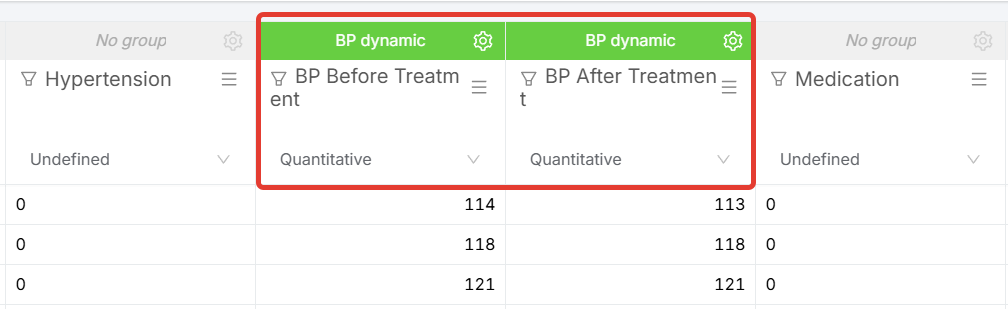
Figure 13 - Example of combining several columns into one group
You can edit a previously created group. To do this, go to “Column settings” -> “Groups”. Find the group you want to edit and click on the pencil icon  (Fig. 14).
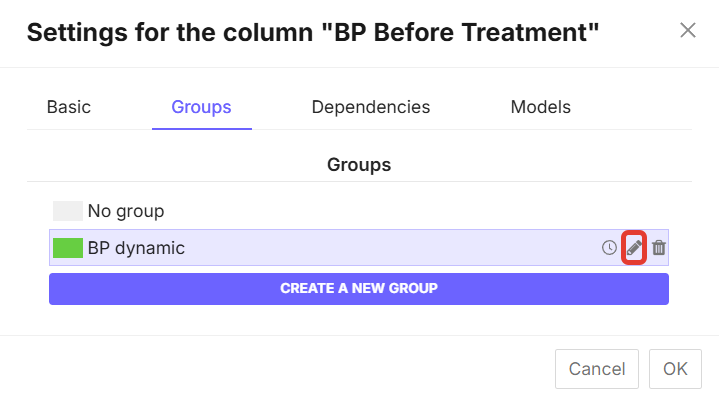
Figure 14 - Group edit button
If necessary, you can also delete an unnecessary group. To do this, go to “Column settings” -> “Groups.” Click on the trash can icon on the group you no longer need  and the group will be deleted (Fig. 15).
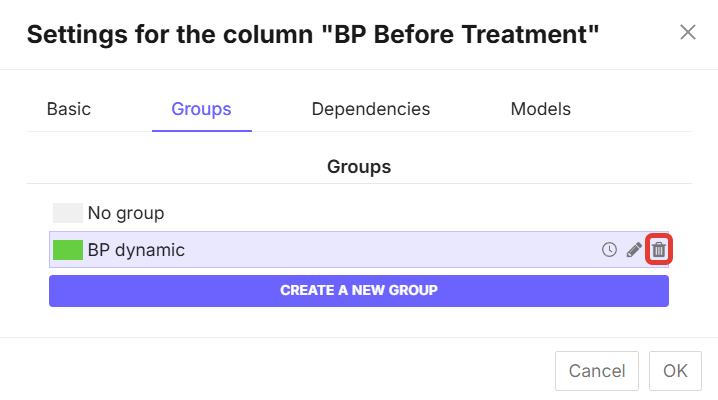
Figure 15 - Delete group button
¶ Data modification
¶ Functions “Insert...”, “Sort...”, “Clear all values”, “Delete”, add “N rows” / “N columns”
The column under the  sign contains functions for changing data, including inserting, sorting, converting, and deleting columns (Fig. 16).
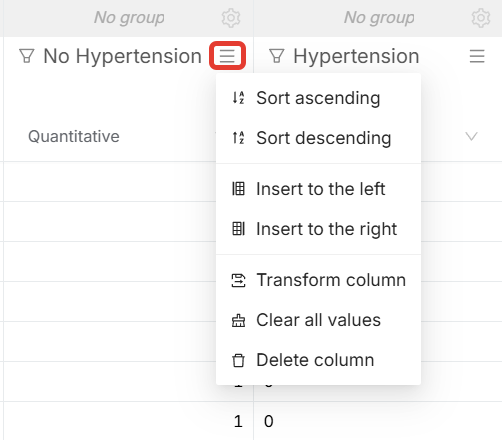
Figure 16 - Additional functionality button on the column
“Sort ascending” and ‘Sort descending’ mean sorting the indicators designated by numbers from the smallest value to the largest and vice versa, respectively.
Columns with text values, such as patient names, will be sorted alphabetically. If you apply “Sort Ascending,” the data in the column will be sorted from A to Z. If you use “Sort Descending,” it will be sorted from Z to A.
The “Insert Left” and “Insert Right” buttons add a new empty (not filled with data) column to the left or right of the column on which you use this button (Fig. 17).
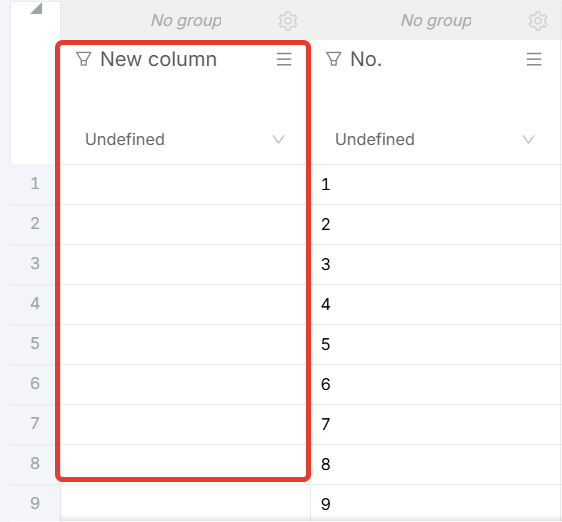
Figure 17 - Results of the “Insert Left” button
The “Clear All Values” function deletes all values in the column, but the column itself remains in the database (Fig. 18).
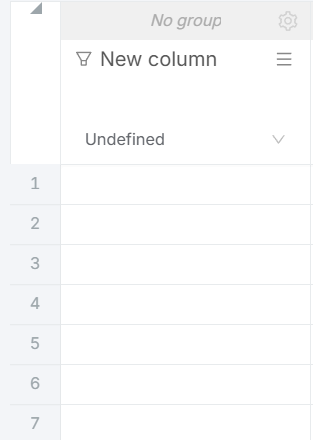
Figure 18 - View of the column after clicking the “Clear all values” button
The “Delete column” function deletes the entire column with all the data in it.
The “Convert Column” button means copying the column with all its values or converting its data. The data conversion functionality is discussed in a separate subchapter.
You can add multiple rows by clicking the “Add” button at the bottom left of the page. By default, clicking the button adds one row. If you need to add multiple rows, enter the number in the window next to it and then click the “Add” button (Fig. 19).
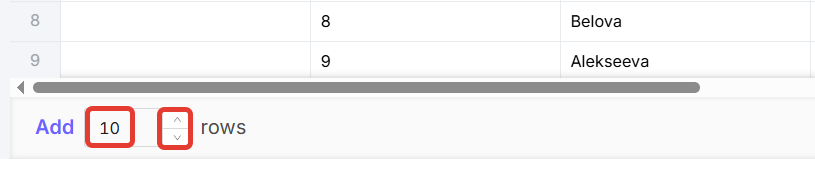
Figure 19 - “Add” button and window for entering the number of rows
Adding multiple columns is available by clicking the button  at the end of all database columns (Fig. 20).
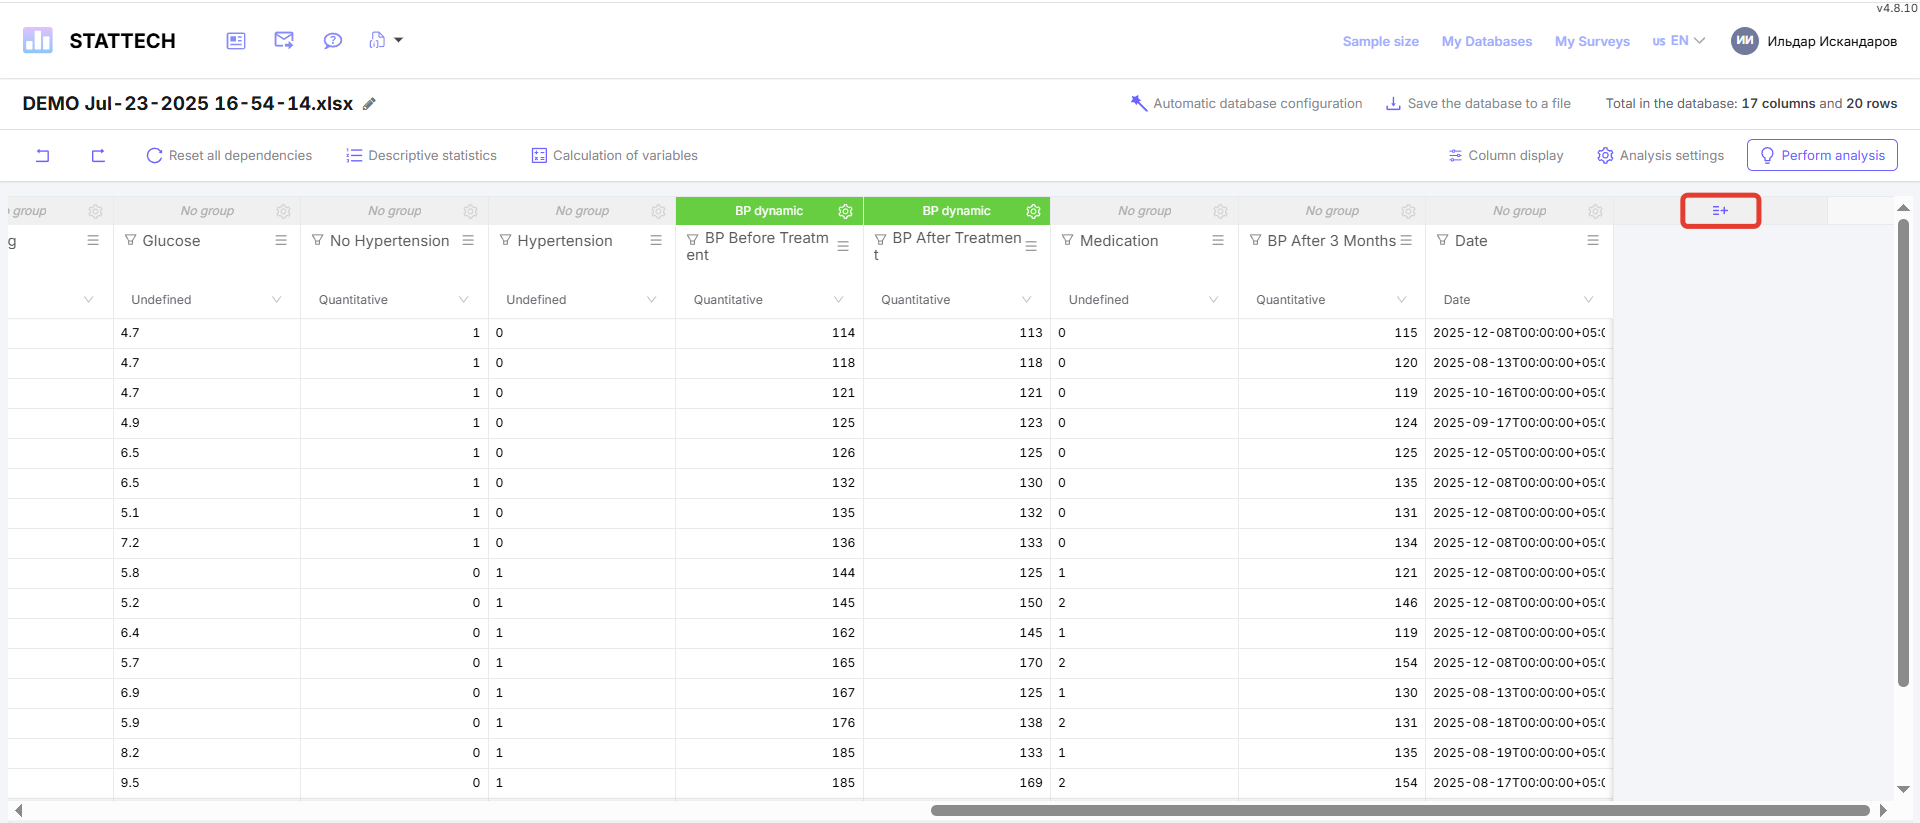
Figure 20 - Functionality for adding multiple columns
If you need to add multiple columns, enter the number in the “Number of columns” line, and then click the “Add” button (Fig. 21). By default, the number 1 is “hard-coded” in the line to add one column.
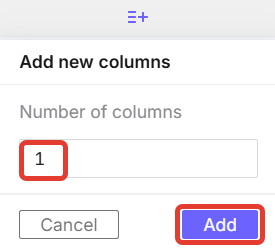
Figure 21 - “Add” button and window for entering the number of columns
¶ Convert Column Function
Click the Convert Column button (Fig. 22).
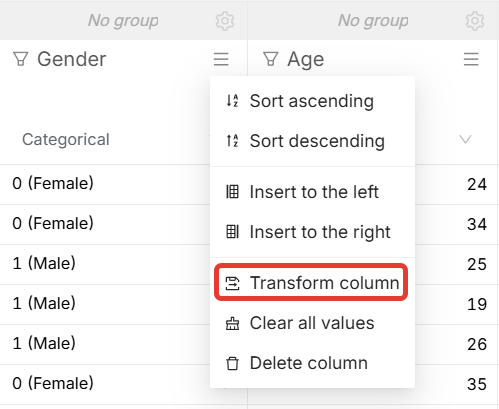
Figure 22 - Convert Column button
After clicking the button, the column conversion window will appear. Here you need to fill in the “Name” field - this is the name of the new column. You also need to select “Mode”. (Fig. 23).
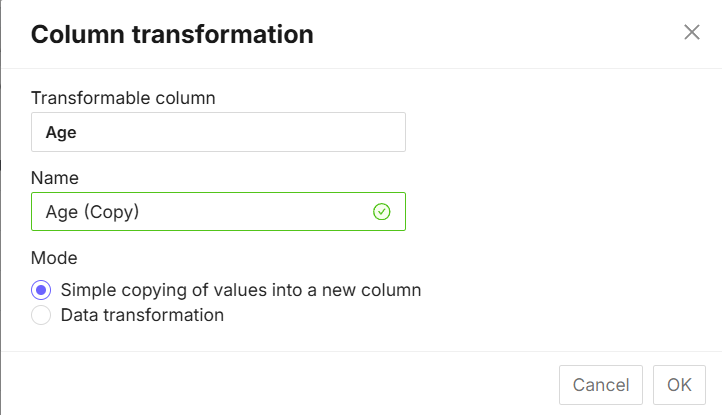
Figure 23 - Column conversion window
Selecting the “Simply copy values to a new column” mode means copying the column with data without any changes (Fig. 24).
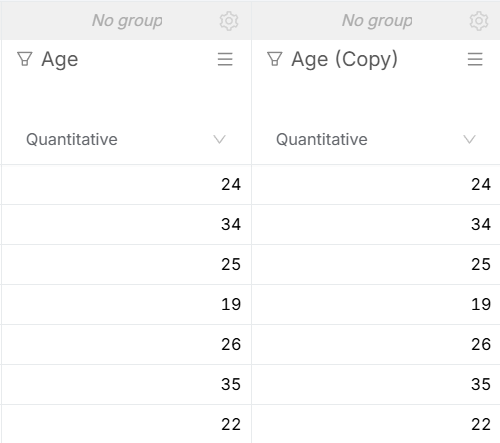
Figure 24 - Example of simple copying of values to a new column
Selecting the “Data conversion” mode will open additional functionality (Fig. 25).
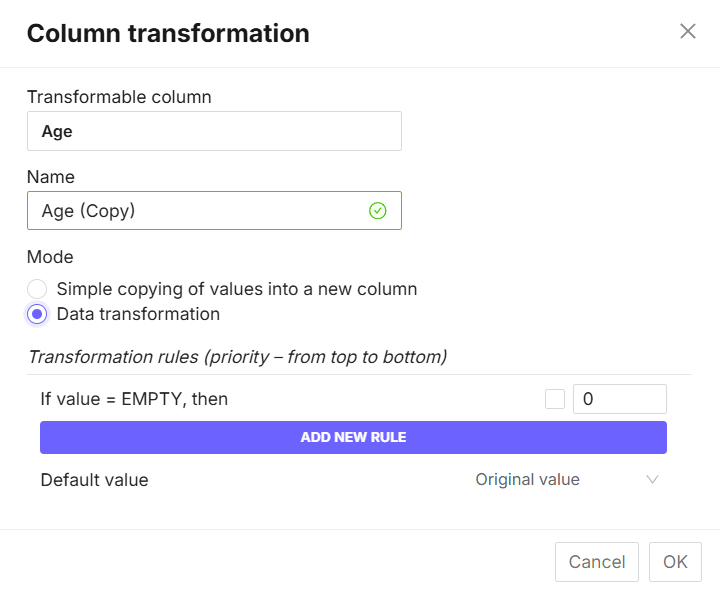
Figure 25 - Functionality of the “Data conversion” button
In the “Conversion rules” window, click on the “Add new rule” button (Fig. 26). A rule is defined as a condition and the result of recoding values according to the principle “IF <condition>, THEN <result>”.
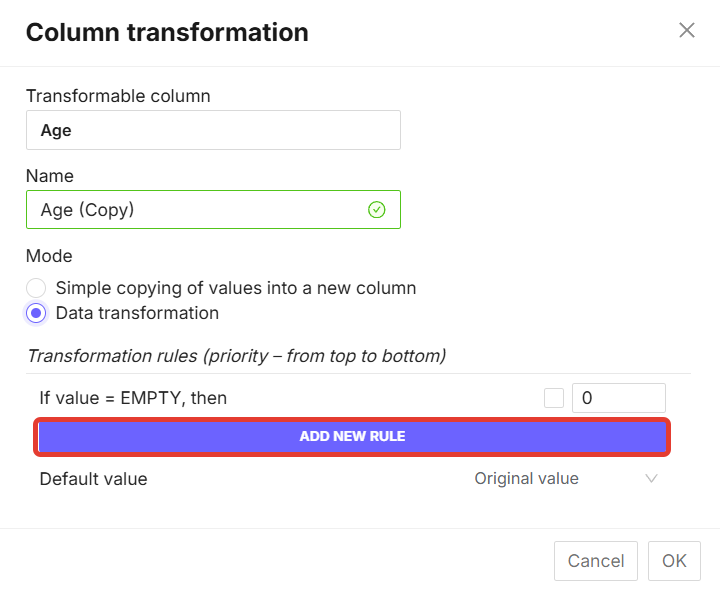
Figure 26 - “Add New Rule” button
Various conversion rules are available in StatTech.
- Assigning a new value to the original values up to a certain number. For example, “If age is less than 40, assign the value 1.” Values in the original column up to and including 40 will be recoded in the new column with the number 1 (Fig. 27).
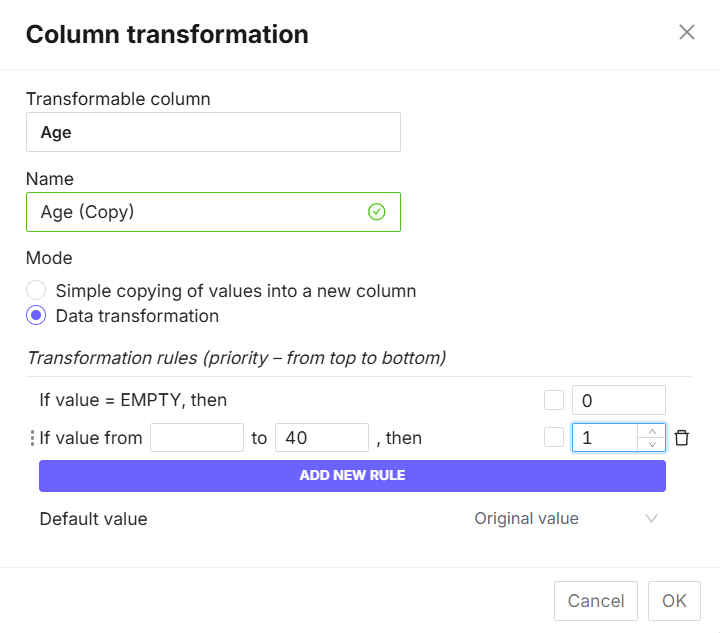
Figure 27 - Example of assigning a new value to the original data up to a certain number
- Replacing empty values with a specific number. For example, “If there are empty cells in the age column, assign them the value 35” (Fig. 28).
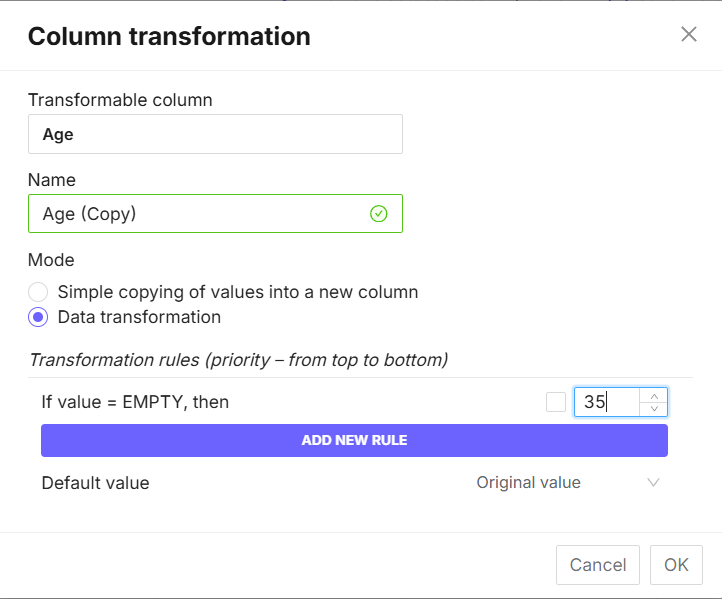
Figure 28 - Example of replacing empty values with a specific number.
- Replace specific values or ranges with empty cells. For example, “If the age is between 1 and 17, replace the values with empty cells” (Fig. 29).
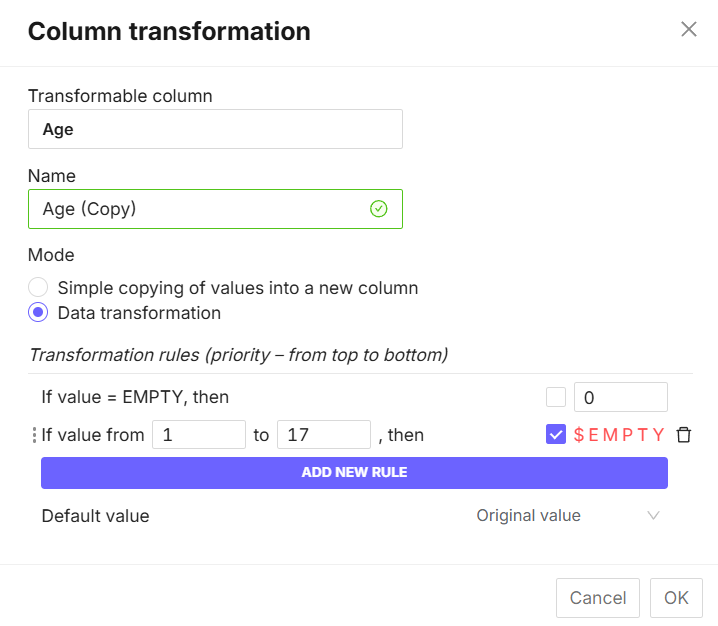
Figure 29 - Example of replacing a range of values with empty cells
- Replacing the remaining values not defined by other rules with a specific value or empty cells. To do this, select “Default value” -> “Initial value” in the line (Fig. 30). By clicking on the sign
 , you will see a drop-down list where you need to select whether the remaining values will be equal to “Empty” (Fig. 31) or “Value” (Fig. 32).
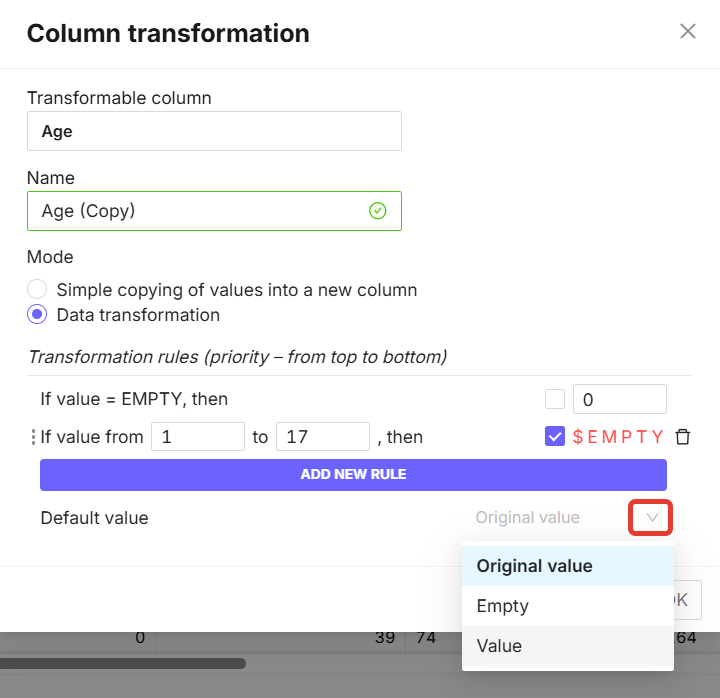
Figure 30 - Default value selection button
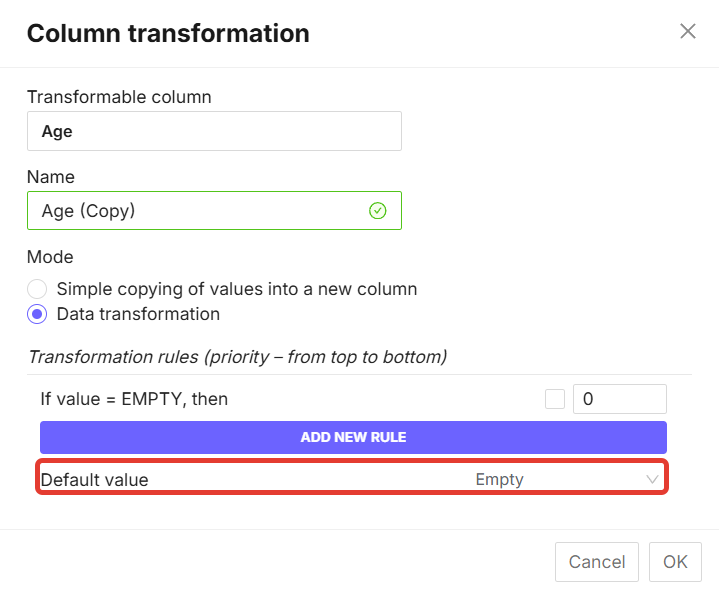
Figure 31 - Replacing values not defined by rules with empty cells
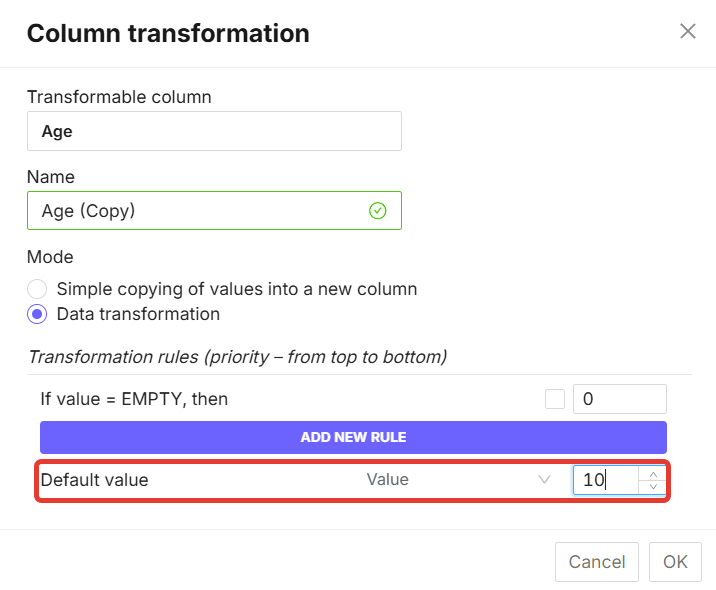
Figure 32 - Replacing values not defined by rules with a specific value
Column conversion rules are applied sequentially, from top to bottom. Therefore, for complex conversion options, you can use open ranges. For example, recoding the “Body Mass Index” (BMI) variable to “Degrees of excess body weight” according to the following scheme:
- If BMI < 25 kg/m2, then 1 (normal or underweight),
- if 25 ≤ BMI < 30, then 2 (overweight),
- if BMI ≥ 30, then 3 (obese),
can be described by the following rules:
- If BMI ≥ 30, then 3,
- if BMI ≥ 25, then 2,
- if BMI < 25, then 1.
This order ensures the correct definition of range boundaries, taking into account the inclusion (≥, ≤) or exclusion (>, <) of threshold values. An example of recoding is shown in Fig. 33.
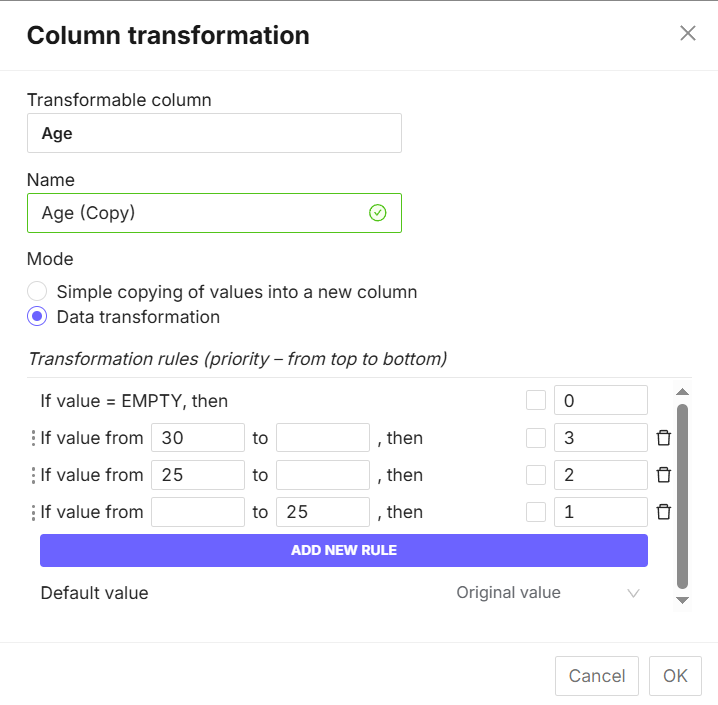
Figure 33 - Example of filling out a continuous data form
The trash can icon  allows you to delete the created rule. After filling in all the data conversion rules, click the “OK” button. A new column with the converted data appears next to the column where the conversion was configured (Fig. 34).
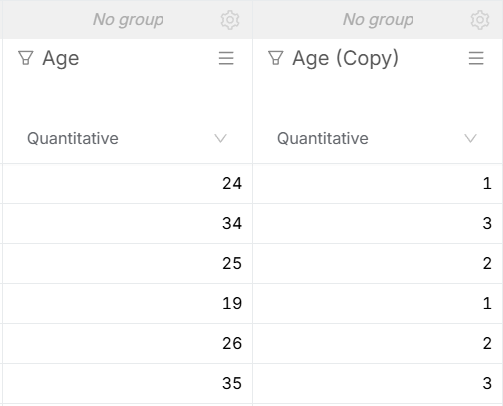
Figure 34 - Example of converting the BMI column
¶ Column Display Function
The column display function allows you to hide columns/variables that do not have a data type specified. To do this, click on the “Display Variables” button and uncheck the “Display columns with undefined data type” box (Fig. 35).
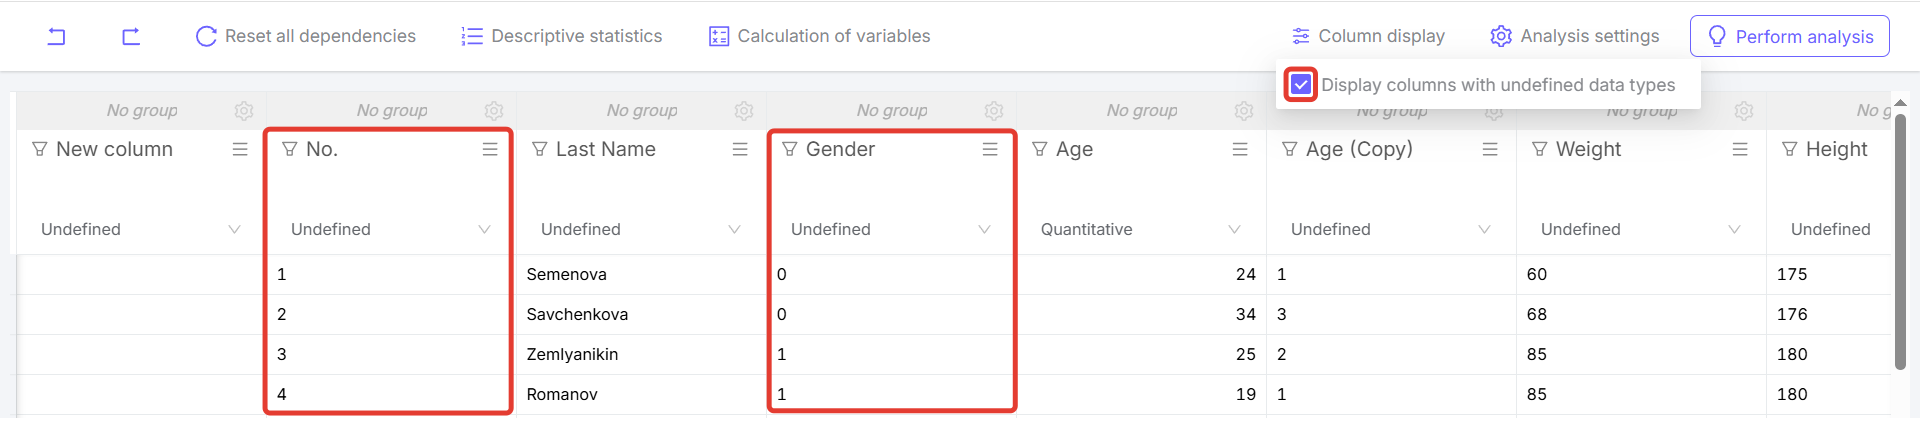
Figure 35 - “Display Columns” function