¶ Preparing the database
To perform statistical data processing using our online service, you need to follow just three steps:
The database design for the StatTech service is no different from the principles of preparing a database for any other statistical program and involves following a few simple, generally accepted rules:
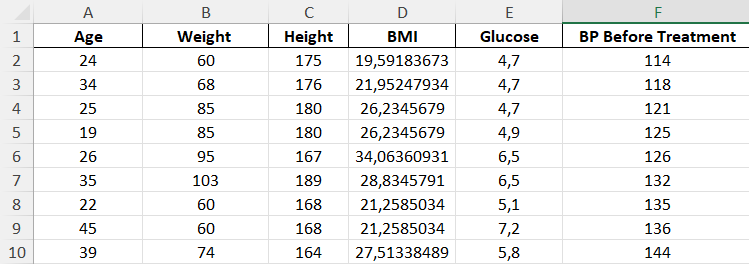
- The data in the database table (Fig. 1) is arranged as follows:
-
Rows represent patients (clients, animals, other observation units). Data for each patient fits into one row.
-
Columns represent indicators (age, gender, blood pressure, etc.).
-
The top row of the database contains the names of the indicators without specifying the units of measurement or other additional information. Only the first row in the database is used for the names of the indicators.
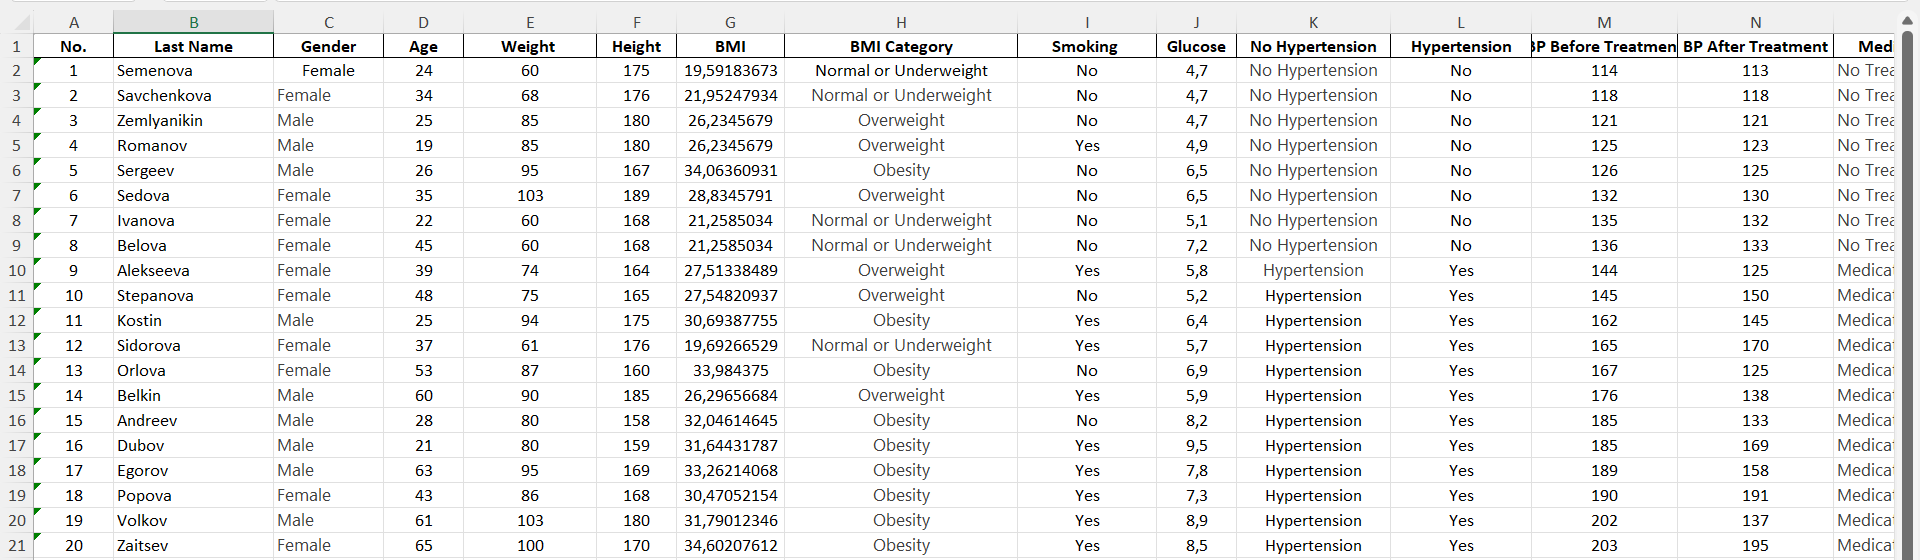
Figure 1 - Example of a database table in MS Excel
Do not merge any cells in the database (Fig. 2):
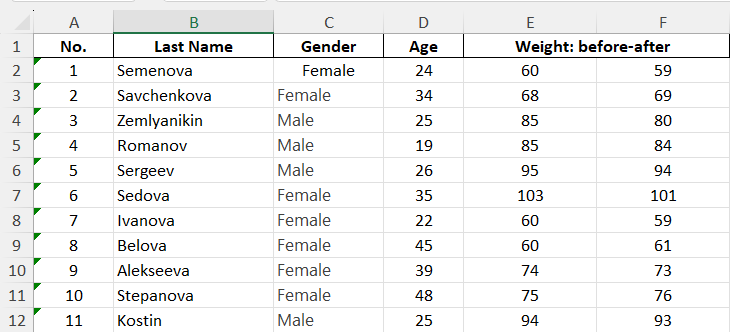
Figure 2 - Example of an incorrectly formatted database table - merged cells
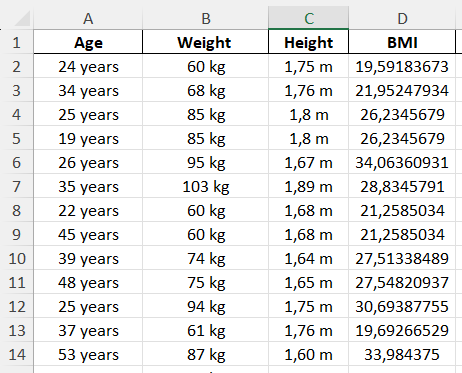
Do not use more than one row for indicator names (Fig. 3):
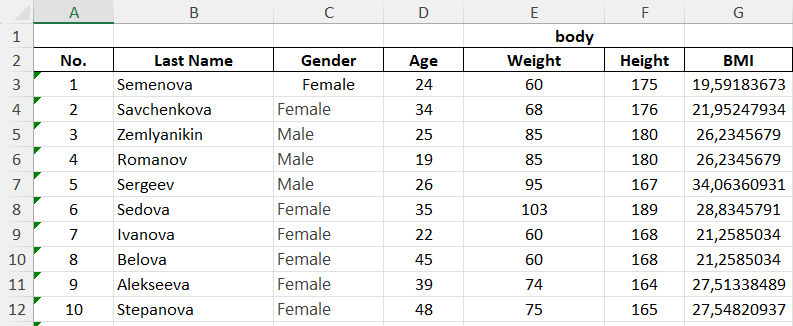
Figure 3 - Example of an incorrectly formatted database table
- All indicators must be numerical. The use of text variables is not permitted. Categorical variables are coded according to their values, each of which is assigned a number.
For example, in the “Gender” column, you should not indicate “male” or “female,” but rather numerical designations: 1 and 2, respectively.
For indicators whose values imply ranking, assign numerical codes in ascending order.
For example, degrees of disease severity: mild - 1, moderate - 2, severe - 3.
Don't forget to write down and save the key to the codes used separately for yourself, it will come in handy when uploading the database to the StatTech portal!
Example of the original database with text designations of categorical variables (Fig. 4):
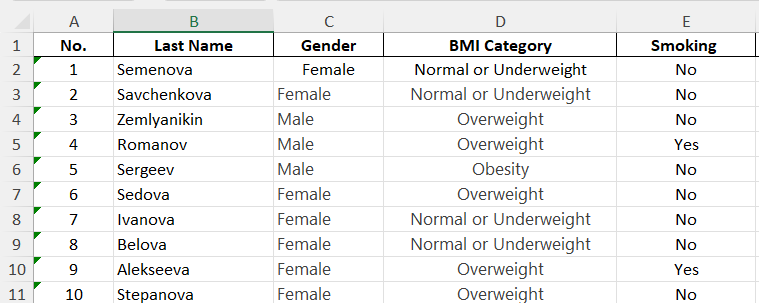
Figure 4 - Example of a database with text designations of categorical variables
The same database after recoding categorical variables (Fig. 5):
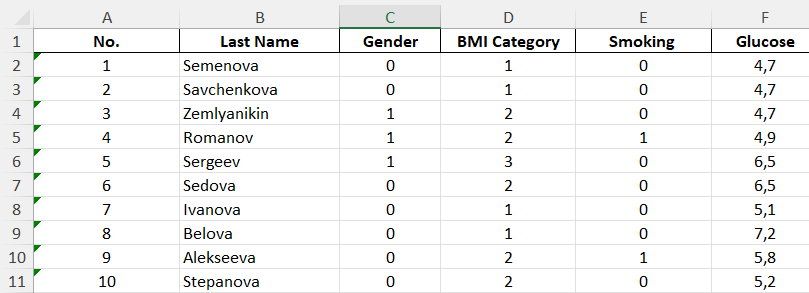
Figure 5 - Example of a database with recoded text categorical variables
Key to the database:
- Gender: 0 - female, 1 - male
- Profession: 1 - worker, 2 - employee, 3 - manager
- Presence of AH: 0 - absent, 1 - present
- AG degree: 0 - no AG, 1 - first, 2 - second, 3 - third
3) Quantitative indicators are given in numerical format without specifying the units of observation. Use either a comma or a period as a separator (Fig. 6).
Incorrect designation
Different separators are used
Values are indicated together with units of measurement
Correct designation
A comma is used as a separator
Only numbers are used in the database cells
4) Some categorical indicators take several values at once for the same unit of observation.
For example, this applies to concomitant diseases, of which a single patient may have several. In such cases, it is unacceptable to indicate several values in one cell separated by commas. It is necessary to create several columns with separate diseases, in which the data is entered in binary form: 1 (meaning “This disease is present”) or 0 (“This disease is not present”).
- Assign the most complete names to the indicators, as you would like to see them in tables and graphs. They will be used unchanged when presenting the results of your data analysis.
For example, instead of “Glucose,” it is better to write “Blood serum glucose content.”