¶ DESCRIPTIVE STATISTICS
Descriptive statistics is the evaluation of a data sample. It is constructed depending on the type of statistical data.
- Categorical indicators are described in a table showing absolute values and their percentages (Fig. 1).
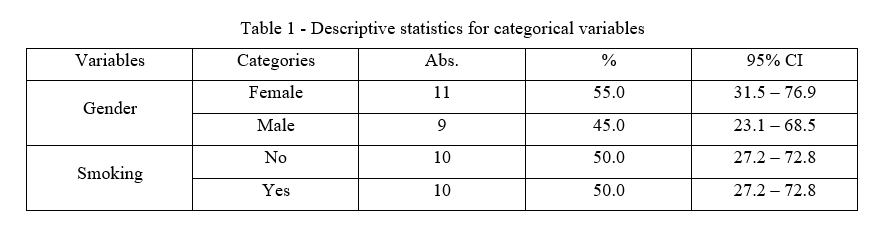
Figure 1 - Example of descriptive statistics for categorical indicators
- Quantitative indicators are described depending on the distribution. With a normal distribution, variables are described using the arithmetic mean (M), standard deviation (± SD), and 95% CI (confidence interval). Min-max values are also used to describe variables (Fig. 2).
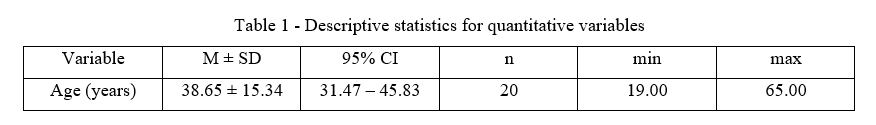
Figure 2 - Example of descriptive statistics for quantitative variables with normal distribution
3. For distributions other than normal, variables are described using the median (Me) and interquartile range (Q1-Q3). Min-max values are also used to describe variables (Fig. 3).
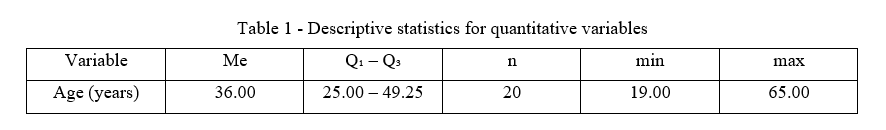
Figure 3 - Example of descriptive statistics for quantitative variables with a distribution other than normal
The descriptive statistics button is located above the columns (Fig. 4).
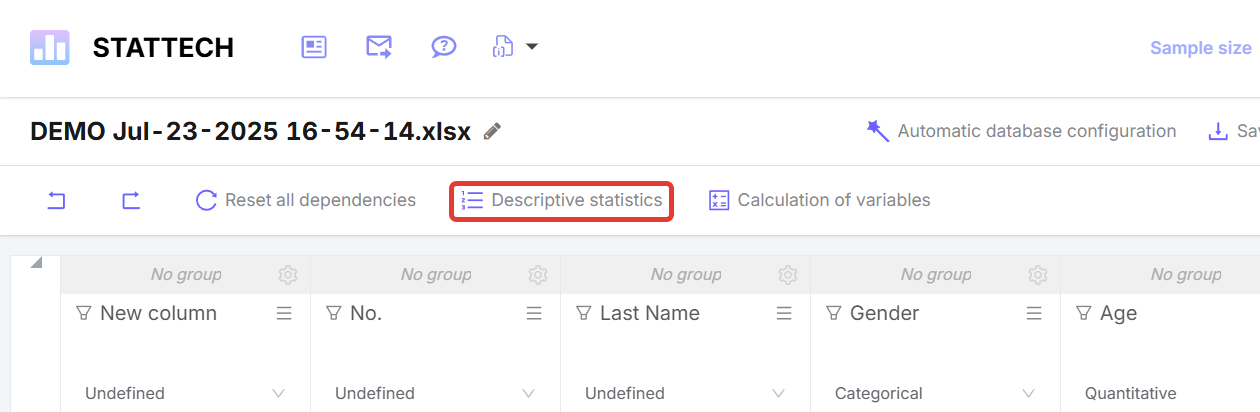
Figure 4 - “Descriptive statistics” button
Clicking on the “Descriptive statistics” button opens a list of all columns. In this section, you can select either several indicators for descriptive statistics or select all (Fig. 5 and Fig. 6).

Figure 5 - Example of selecting several indicators for descriptive statistics

Figure 6 - “Select All” button in the “Descriptive Statistics” section
If you need to deselect indicators, click “Select all” again. This will deselect all indicators.
After selecting all the necessary indicators for descriptive statistics, click the “OK” button. Next, click the “Perform analysis” button in the upper right corner of the page (Fig. 7).

Figure 7 - “Perform analysis” button