¶ ANALYSIS SETTINGS
The function for customizing the analysis is located in the upper right corner of the database and is marked with a gear icon  (Fig. 1).
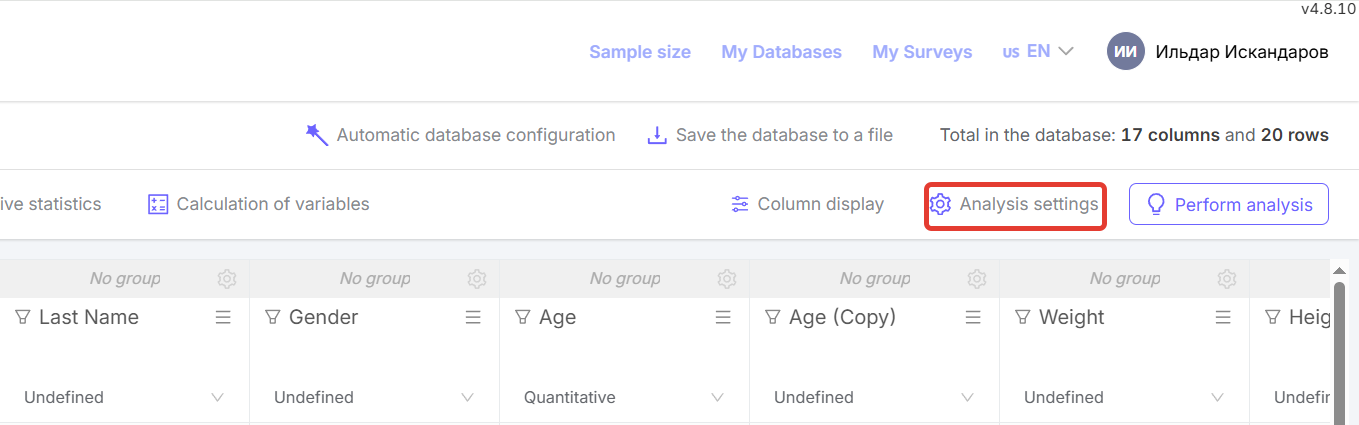
Figure 1 - “Analysis Settings” button
Clicking on “Settings” opens the analysis settings editing form, which includes:
-
“Normality check” allows the user to select one of three options for processing quantitative indicators:
-
“Performed” (default) - the data is first checked for normality of distribution using the Shapiro-Wilk (applied when N<50) and Kolmogorov-Smirnov (applied when N>50) criteria. If the data conforms to a normal distribution, the description and analysis are performed using parametric methods. If the distribution is not normal, the description and analysis are performed using non-parametric methods.
-
“Always normal” - the distribution is not checked for normality. Regardless of the distribution of the data, their description and analysis are performed using parametric methods.
-
“Always ‘abnormal’” - the distribution is not checked for normality. Regardless of the distribution of the data, its description and analysis are performed using non-parametric methods.
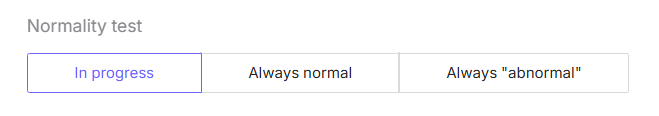
Figure 2 - “Normality check” functionality in the analysis settings
-
Displaying diagrams - this is the ability to generate data analysis:
-
without diagrams (the “Show diagrams” switch is off),
-
with all diagrams (the “Show diagrams” switch is on, the “Show all diagrams” button is active),
-
with charts only for statistically significant results (the “Show charts” switch is on, the “Only for significant results” button is active) (Fig. 3).
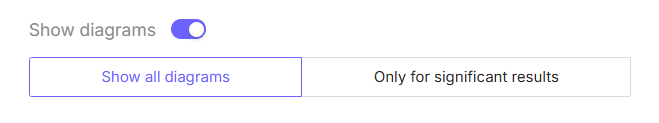
Figure 3 - Functionality for displaying charts in the analysis settings
- “Color scheme for graphs” allows you to select a color range for charts and graphs from 9 options (Fig. 4).
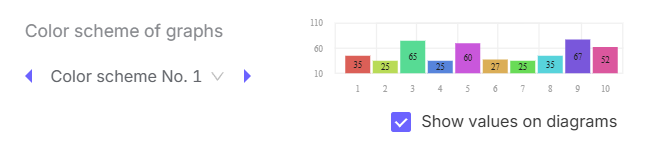
Figure 4 - “Color scheme for graphs” in the analysis settings
- The “Show values on charts” function turns the display of numerical values on charts on and off (Fig. 5).
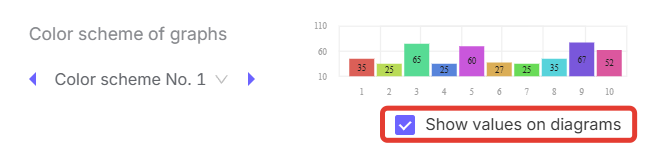
Figure 5 - “Show values on charts” function in the analysis settings
- “Analysis result language” - selection of the language in which the statistical data analysis is generated in MS Word (Fig. 6).
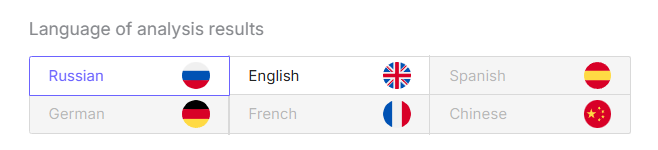
Figure 6 - The “Analysis result language” selection function in the analysis settings
- “P-value measurement accuracy” - the number of decimal places is specified here (Fig. 7).
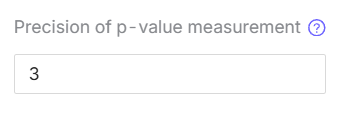
Figure 7 - “p-value measurement accuracy” in the analysis settings
- “p-value threshold” - the p-value threshold below which the indicators will be considered statistically significant (Fig. 8).
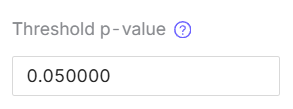
Figure 8 - “p-value threshold” in the analysis settings